

What the Phoenix Market Statistics are showing in October 2017
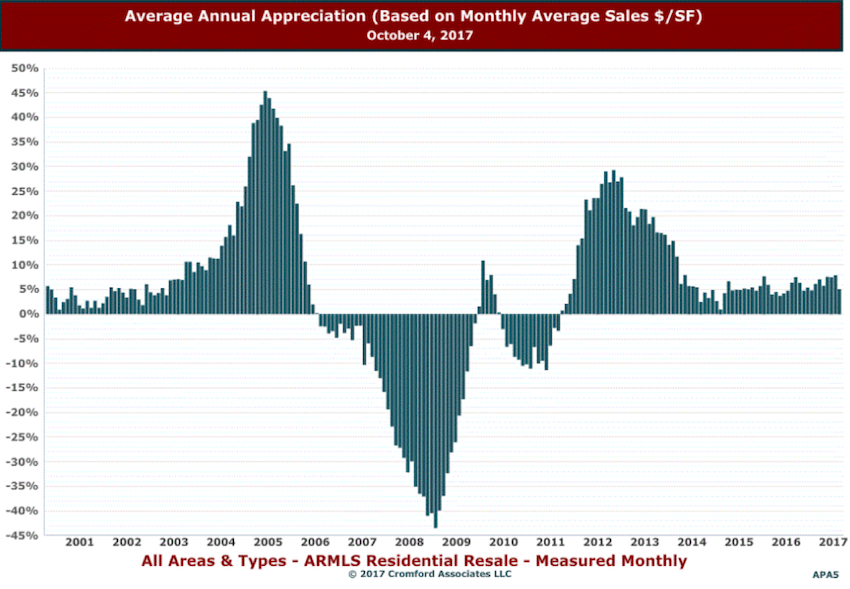
It pays to keep oneself in check as far as reacting to a market without the most current and accurate knowledge available to help in your decision-making. I wrote another blog this morning on the 2017 Annual Appreciation Market Overview and whether the real estate market is in what we would call a bubble. From the Phoenix Market Statistics (Cromford Report, 10/16/2017) below, one can see that we are not in runaway growth… In fact, one would report it appears a little lackluster. Thus, no bubble. It’s hard when thinking back to the market of 2004-2006, as stability was a non-existent word and we were all living in the midst of a euphoric environment.
Today, we are dealing with trend lines that remind me of days gone by. Real markets and not a roller-coaster schematic of a runaway buying-and-selling frenzy where collapse is on the horizon. Nobody, trust me… NO ONE wants to revisit the housing market of 2008-2011.
Cities showing a declining trend in appreciation rate:
- Arizona City peaked at 17.9% in May but has retreated to 12.0% now
- Avondale peaked at 10.7% in July but has retreated to 9.2% now
- Buckeye peaked at 9.9% in February but has retreated to 7.4% now
- Fountain Hills was at 3.3% in January but has fallen to 0.7% now
- Laveen has dropped from 10.4% in January to 7.4% now
- Maricopa has declined steadily all year from 11.6% in January to 6.4% now
- Phoenix has dropped from 7.4% in January to 5.2% now
- Sun City West has dropped from 9.2% in January to 6.0% now
- Tempe has dropped from 6.2% in January to 4.8% now
- Tolleson has dropped from 11.2% in January to 7.3% now
Cities on an improving appreciation trend:
- Anthem, relatively slow, has started to catch up, increasing from 1.6% in January to 3.9% now
- Apache Junction has increased from 5.7% in January to 8.9% now
- Casa Grande has increased from 6.1% in January to 9.7% now
- Gold Canyon was at -0.7% in January and has increased dramatically to 7.1% now
- Litchfield Park was at a low of 5.5% in May and has improved to 8.8% now
- Mesa was at 5.8% in January and has advanced to 7.3% now
- Paradise Valley has improved from -1.4% in January to 4.6% now
- Peoria has increased from 5.2% in January to 7.1% now
- Queen Creek has increased steadily from 7.0% in January to 8.2% now
- Scottsdale has seen modest improvement from 2.7% in January to 3.6% now
- Sun Lakes has increased from 3.7% to 5.9% now
- Surprise has increased slowly but steadily from 6.7% in January to 7.7% now
Cities with minor change in appreciation rates:
- Cave Creek was at 4.6% in January and is at 5.2% now
- Chandler was at 6.2% in January and is at 5.6% now
- El Mirage was at 13.8% in January and is at 12.8% now
- Gilbert was at 5.3% in January and is at 5.6% now
- Glendale was at 6.9% in January and is at 7.0% now
- Goodyear was at 6.3% in January and is at 6.9% now
- Sun City was at 10.1% in January and is at 9.7% now
Greater Phoenix Real Estate: A Mixed Picture
This is a pretty mixed picture with fortunes changing in many different directions. All the appreciation rates are now positive (two were negative in January), which is a good sign. However, the slowdown in our largest city of Phoenix (about 25% of the total market) means the overall trend is the slightest bit lower now.
Mackey Martin, PLC
Realty Executives
480-688-2747